
 开源社区
开源社区
【昉·星光2 RISC-V 单板计算机】软件测试
本文介绍了 VisionFive2 开发板安装教育和科研办公等相关软件,并完成一系列常用方案的测试,验证系统和软件运行的兼容性和稳定性。
文件远程管理
通过 FileZilla 软件实现板端文件的远程访问和管理
apt install filezillaWindows 安装 FileZilla 软件,运行软件;
文件 - 站点管理器 - 新站点 - 命名;
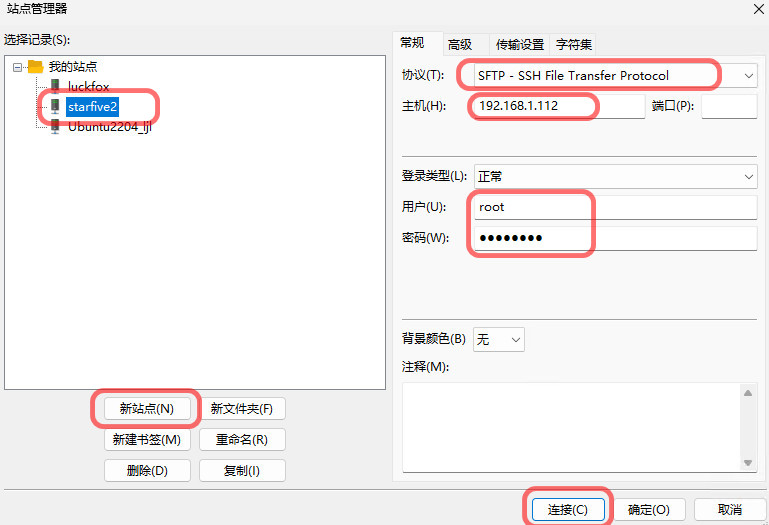
协议选择 SFTP - 填写连接的目标主机 IP 地址、用户名、密码 - 点击 连接 ;
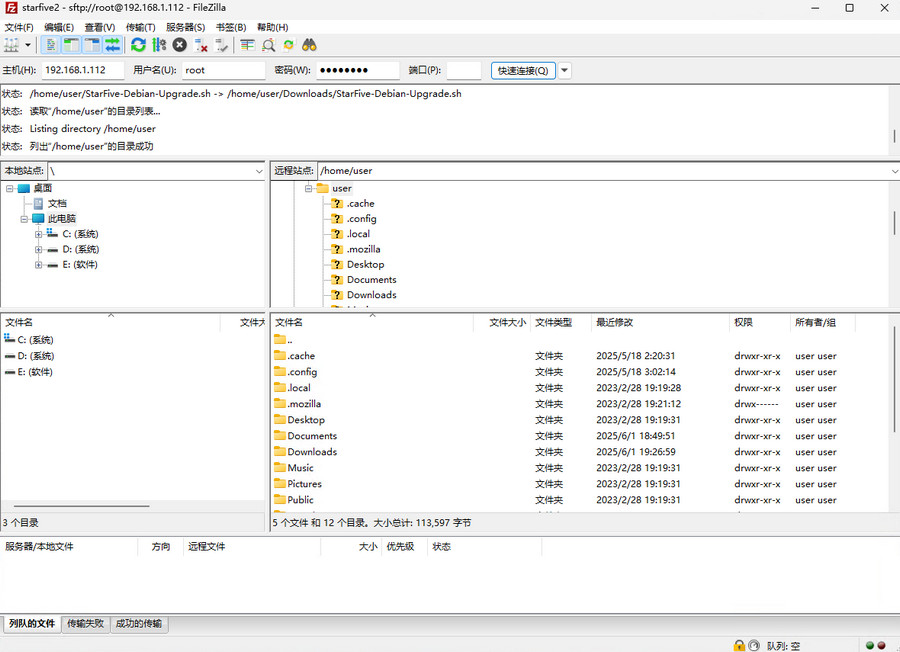
可访问 VisionFive2 板端文件,执行查看、复制、粘贴、下载、删除和传递等操作,为设备运行和调试提供了便利。
安装 Scratch 编程软件
终端执行
apt install scratch运行 Scratch 软件
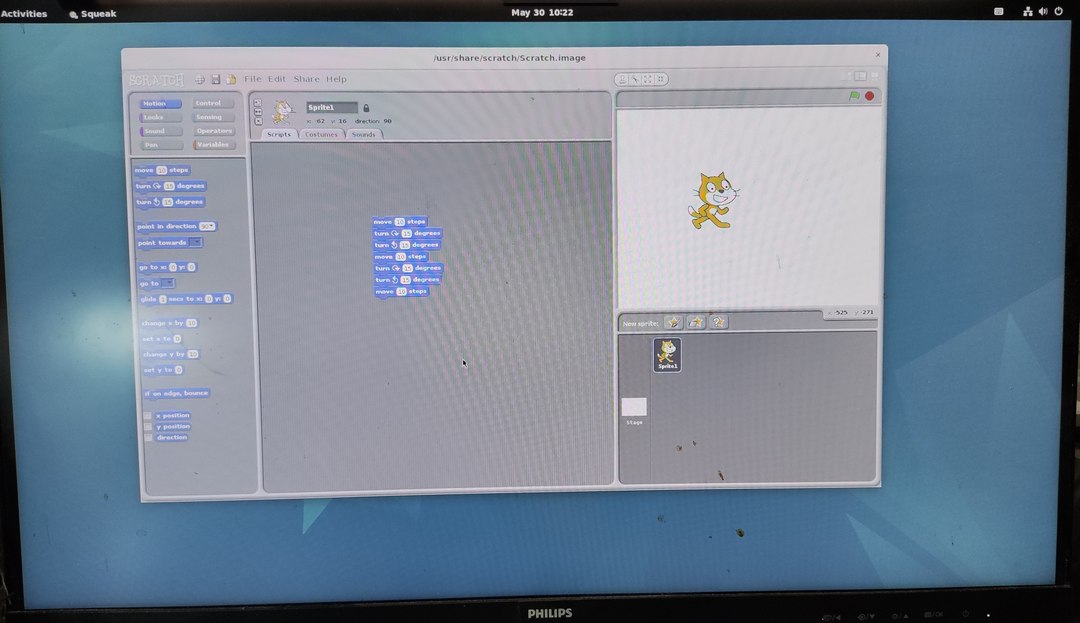
参考:在昉·星光2上安装和运行Scratch少儿编程软件 .
使用 matplotlib 库实现科研绘图
终端执行指令
apt install python3-matplotlib若安装出错,提示缺少 libtiff5 ,则运行 sudo apt --fix-broken install 尝试自动修复依赖问题。
安装完成后,编写绘图代码并运行,可实现各种方案的科研绘图,且处理速度极快,显示效果满意,为科研工作提供了便利。
这里以绘制多条曲线为例,展示该软件包在科研绘图方面的应用。
import numpy as np
import matplotlib.pyplot as plt

# Generate x-axis data (100 points from 0 to 2 pi)
x = np.linspace(0, 2 * np.pi, 100)

# Generate y-axis data (two curves)
y1 = np.sin(x)  # Sine function
y2 = np.cos(x)  # Cosine function

# Create a figure and axis
plt.figure(figsize=(8, 4))  # Set the figure size

# Plot the two curves
plt.plot(x, y1, label='sin(x)', color='red', linestyle='-')  # Red solid line
plt.plot(x, y2, label='cos(x)', color='blue', linestyle='--')  # Blue dashed line

# Add title and labels
plt.title("Sin(x) and Cos(x) Curves")  # Title
plt.xlabel("x-axis")                   # x-axis label
plt.ylabel("y-axis")                   # y-axis label
plt.grid(True)                         # Show grid
plt.legend()                           # Show legend

# Display the plot
plt.show()
执行指令 python3 lines_draw.py 可得到正弦和余弦函数曲线
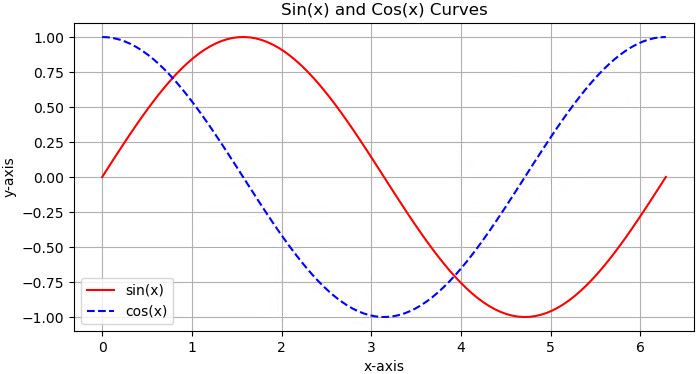
结合 matplotlib 库强大的绘图运算能力和优秀的配色,可获得各式各样的科研绘图效果
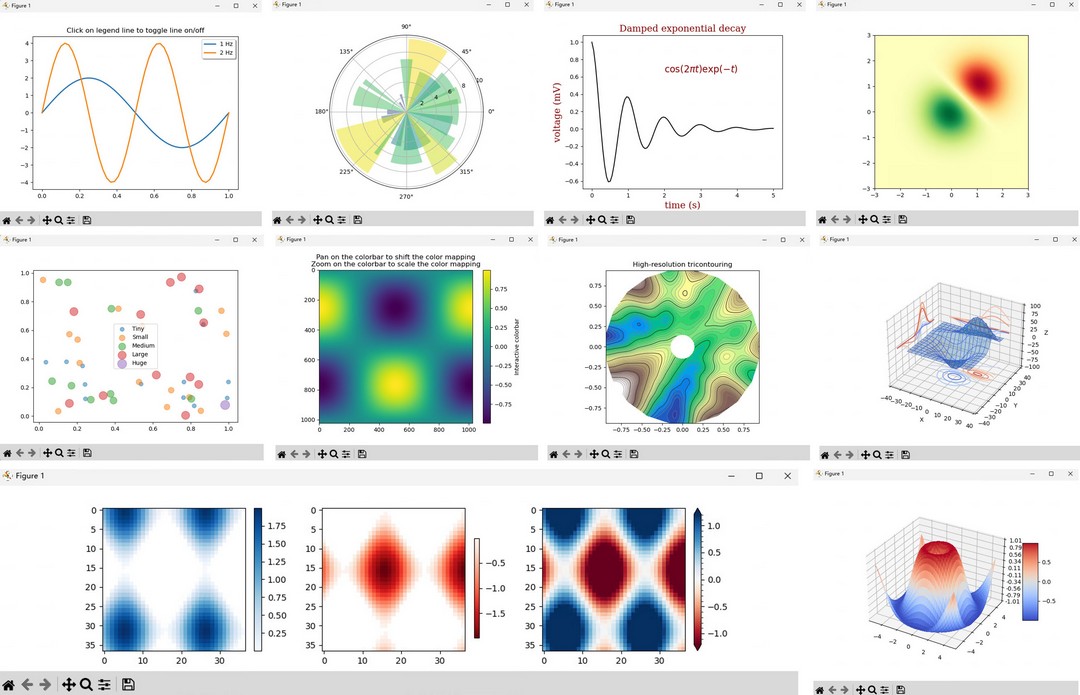
代码参考:Matplotlib documentation — Matplotlib 3.10.3 documentation .
官方软件源更新:Release - starfive-tech/Debian .
总结
本文介绍了昉·星光2 单板计算机安装 Scratch 编程软件、matplotlib 绘图等,为该开发板在教育和科研领域的应用提供了参考。